Adoption and engagement are quickly becoming the most discussed topics in the SharePoint community. Why? Because organizations are realizing that the concept of “build it and they will come” was never true, and that they need to do a better job of tracking and measuring collaboration – and demonstrating business value. They’ve learned that no matter how solid the solution you deploy, adoption takes work.
So, how do you get people to adopt SharePoint?
The best way to get users to use the platform is to enable them to find the people and information they need, when they need it. I’ve often written about change management and governance, which are important in the ongoing support of any healthy SharePoint environment. While both are important, an even more fundamental aspect to SharePoint’s success is the timeliness of information provided. Your environment will never provide the right information to the right people at the right time if you do not continually optimize the search experience.
Search in SharePoint has always been more of an art than a science. The concepts are fairly straightforward: crawl, index, query, rinse and repeat. With SharePoint 2013, these core concepts have remained steady from previous versions, but a number of fairly noteworthy features have been added since SharePoint 2013, which finally saw the integration of FAST search capabilities, and with SharePoint Online (part of Office 365), the introduction of the Microsoft Graph. Another new and important capability in recent years was the inclusion of an analytics processing component.
The Analytics Processing Component
Analytics are an often-overlooked area, but have a crucial role in search — both in providing insight into user behavior and system operations, as well as providing real-time insights into how your system is used (and not used), which can help you in your efforts to improve the user experience. SharePoint 2013 included a new analytics architecture, which merged web analytics (where people click and navigate) and search analytics (what people search for and what results they get). This was a HUGE improvement over SharePoint 2010, where the web analytics service application was quite limited in both capability and scale. The result is called the Web Analytics Platform, which was completely redesigned and integrated into the search service application within SharePoint 2013.
The analytics processing component has two separate components. Search analytics goes through the crawled items to find activity information such as links, related people, and metadata. Usage analytics contain information like views on an item from a front-end event store. The processing component returns the information to the content processing component to include them in the search index. Default usage events are things like views, recommendations displayed and recommendations clicked. Results from usage analytics are then stored in the analytics reporting database. Along with the new analytics processing comes some new default reports such as popularity trends and most popular items.
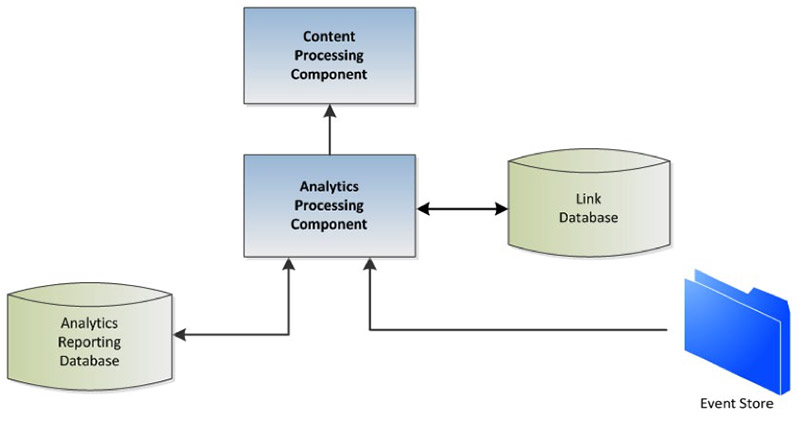
The Analytics Processing Component extracts two kinds of information:
- Search analytics information such as links, anchor text, information related to people, metadata, etc. from items that it receives via the content processing component and stores the information in the link database.
- Usage analytics data, such as the number of times an item is viewed, captured from the front-end via the event store.
The analytics processing component analyzes both types of information. The results are then returned to the content processing component to be included in the search index. Results from usage analytics are also stored in the analytics reporting database for reporting purposes. The analytics component updates the SharePoint search index at time intervals set via a timer job, so it is independent of the crawl schedule. This can be confusing if you are trying to understand why search relevance changed. There is an extension point for custom events, but the analytics processing and search index update data flows are sealed from enrichment updates outside the SharePoint 2013 crawl.
The results are most visible to the user as reports and recommendations. But there are several other ways that analytics shows up:
- Search relevance is enhanced based on user behavior (views, click thru, etc.)
- Popularity of content and of topics in discussion threads — which is driven from number of views as well as number of unique users to view — and can be viewed directly
- Popularity can also be used to create views through the Content by Search (CBS) Web Part
The Value of Search Analytics
Usage analytics in web content management (WCM) are critical, providing essential insights into the adoption and engagement of your environment. These analytics are search driven, built to scale (scaling was a weakness in SharePoint 2010), and open for extension. A “Top Pages” web part is included by default. Some data like view counts are also pushed into the index so it can be included in search results, sorted on (i.e. what’s most viewed), etc.
Personalized search queries and personal query suggestions in SharePoint 2013 are based on analytics data and usage information for each user. Recommendations (both item-to-item and popularity based) are available through this approach, as shown below. The “recommended for you” list is simply a preconfigured Content by Search web part — it looks like a static list but it’s generated dynamically by search.
The addition of both the Link database and the Analytics Reporting database provide for a great deal more personalization, analysis, and relevancy within the engine. The Analytics reporting database has been added to keep track of all forms of analytics. Search Analytics analyze crawled items and how users interact with search results. These actions are stored in the event store within the Web Front End (WFE) server and are regularly pushed to the analytics processing component where the actions are analyzed and reconciled. They are then pushed into the analytics reporting database and made available to the query and processing components. This allows for search to keep track of user actions, queries, and trends to provide the user with better search results and suggestions. This database now powers features such as personal and engine-wide query suggestions, favorites, and other search personalization components not found in any other enterprise search platform today.
Within the analytics system, there are five parts:
- Event: Each item comes into the system as an event with certain parameters
- Filtering and Normalization: Each event is looked at for special handling, normalization, and filtering; some are filtered out
- Custom Events: You can configure up to 12 custom events in addition to what comes OOB
- Calculation: Sum or average across events
- Reports: Several default reports are available, including top queries, most popular documents in a library or site, and historic usage of an item (view counts)
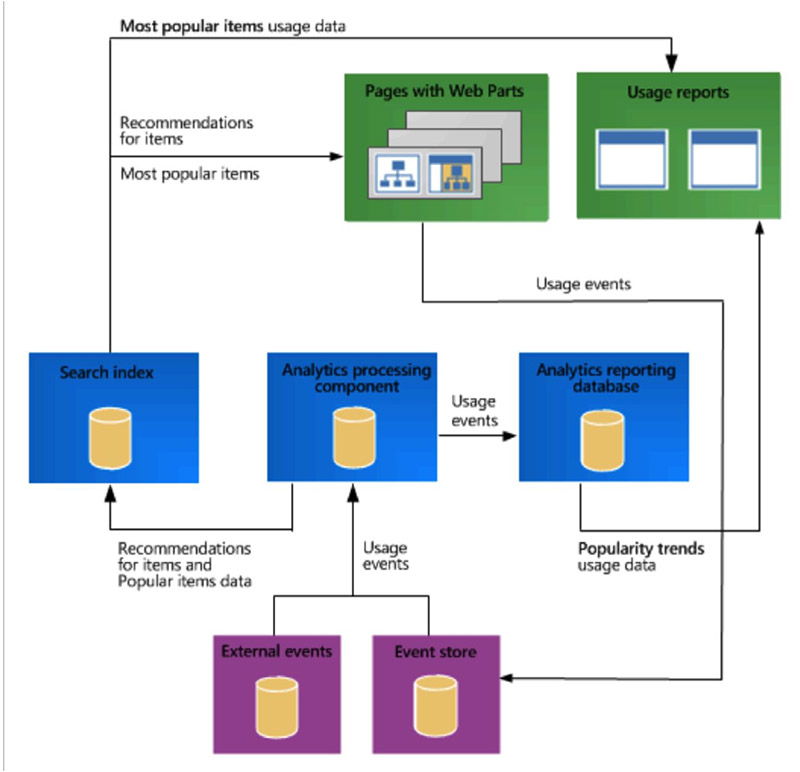
The figure below shows an overview of the data flow for usage analytics, usage events, and recommendations.
Note: 2010 web analytics aren’t supported running 14 mode, so running in 14 mode means running without any analytics.
Better Analytics Mean Better Search
There is a wealth of information available on the web on the topic of the Analytics Processing Component and fine tuning your search analytics in SharePoint, as well as through search experts like BA Insight, who offer analytics solutions for SharePoint Search and the SharePoint Platform. But it helps to first have a search strategy.
Remember that the quality of your search results has a direct correlation to the quality of the query — and the volume of properly tagged, classified, and indexed information that you provide to the search engine. Monitoring and measuring what is searched, by whom, and how it is found is the key to refining and improving the SharePoint search experience. In SharePoint, the addition of the analytics reporting database significantly increases the quality and quantity of information that is provided to the search engine. Knowledge about the person asking the question and the community asking the question greatly improves the quality of results provided by the engine, as well as improving the quality of queries the user issues, and can have a dramatic impact on adoption and engagement within the platform.